Reporting and metrics
Where the work is, where it waits, and what your review bots are worth.

Bots and people are counted apart.
No leaderboards, no developer scorecards.
One stated window
Reports' headline figures cover one window: this sprint so far if you work in sprints, otherwise the last 7 or 14 days. Anything else, such as right now or the last 12 weeks, says so in its heading.
Each tile opens the pull requests behind its figure.
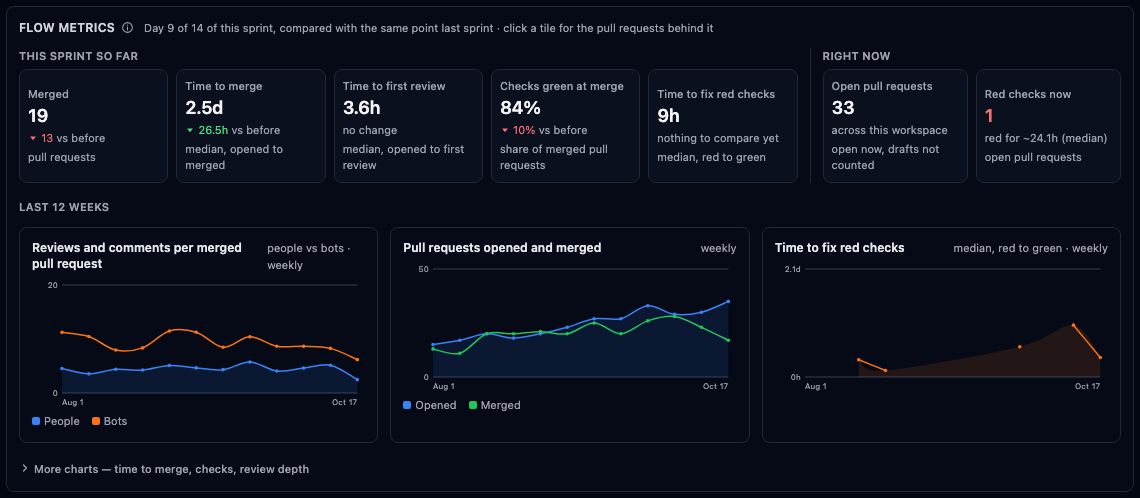
A report per sprint or month
Fifteen measures for each completed sprint or calendar month, against the period before. Month to date is live and costs nothing.
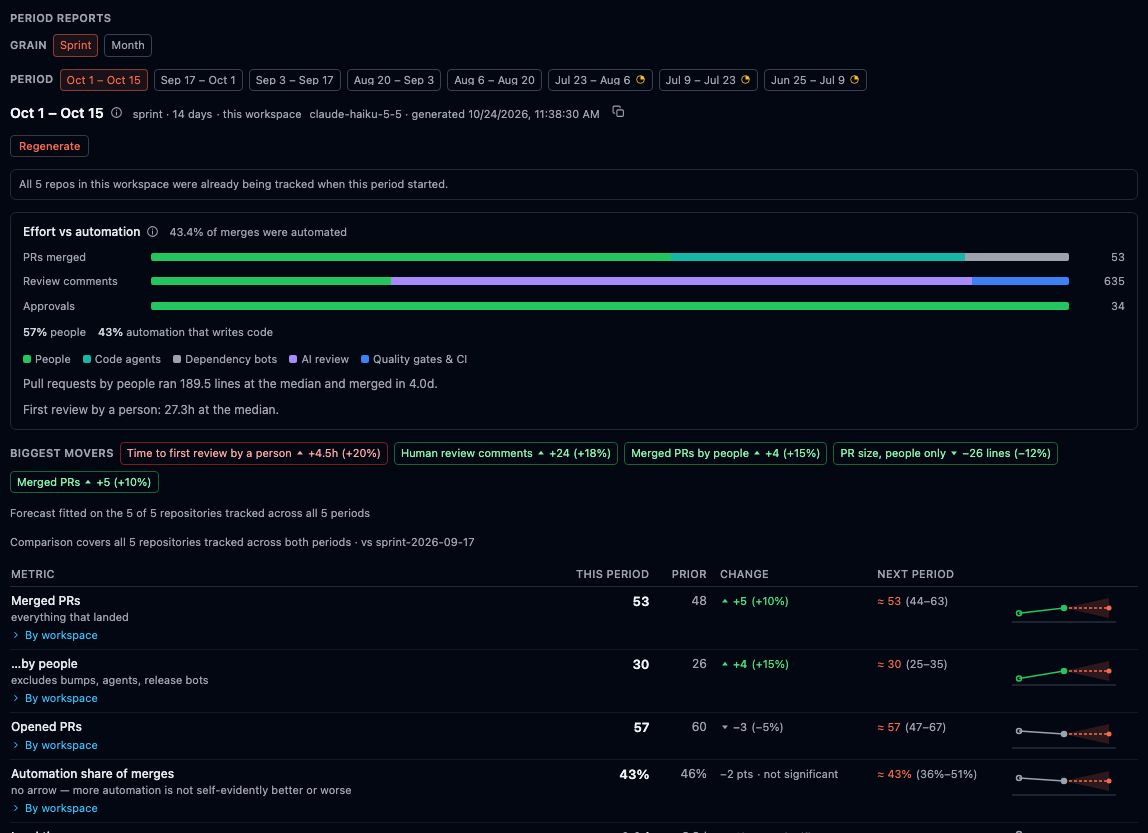
Every figure counts only what happened inside its window, so a report reads the same after you send it.
Changes are compared over the repositories you tracked in both periods, so adding a repo isn't growth.
No forecast for calendar months: they aren't the same length. Where the data can't support a number, it says so.
A short written summary, by your own AI agent.

Where every hour goes
Every hour a pull request is open belongs to someone: a reviewer, the author, or the merge, once it's approved.
- Waiting for a reviewer
- Waiting for the author
- Approved, waiting to merge
Counted in your team's working hours, against time budgets you can change. Bots never move the ball. Pull requests opened by automation, or that no person touched, are left out, and the page says how many.
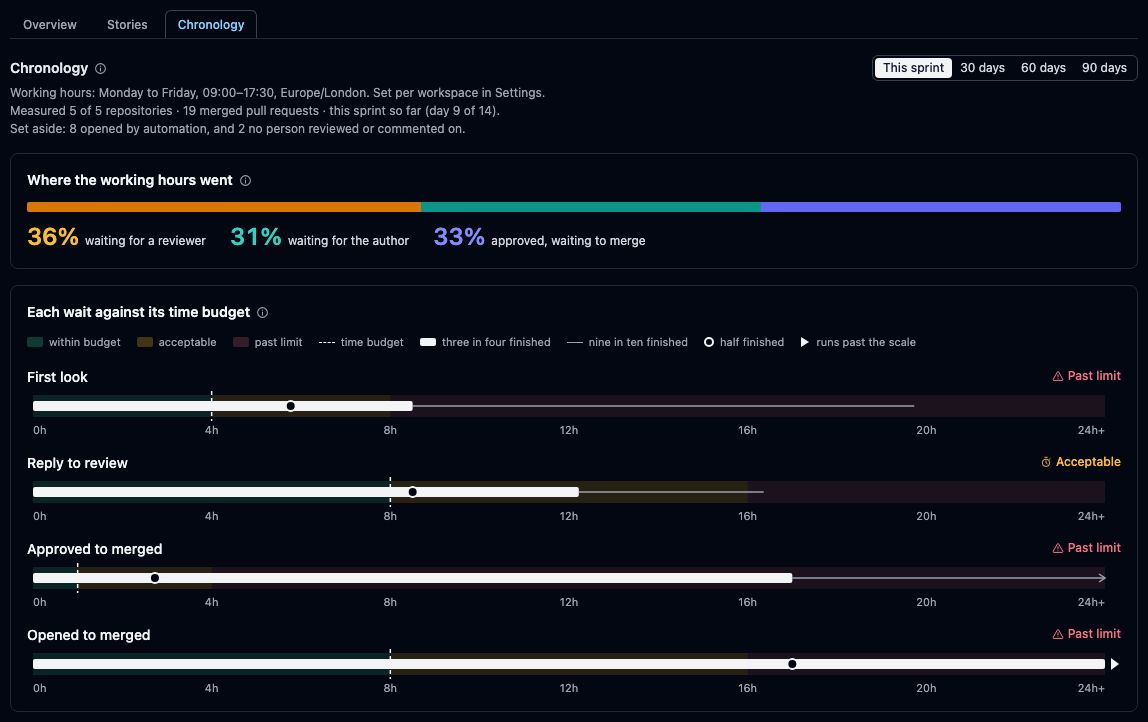
42 min to merge half of pull requests in the week of 19 Oct, from about 7 h in September
Faster reviews, fewer bottlenecks
On a nine-repository delivery team, Limn took over the reviews in October. Half of their pull requests now merge within an hour of working time, and twice as many land each week. It cost them nothing extra.
Measured by Limn's Chronology report: merged pull requests by people, working hours, September vs the week of 19 October 2026.
Hours saved, in dollars
Add an optional hourly cost and the working hours saved also read as an estimate in US$. Until you set one, it stays blank.
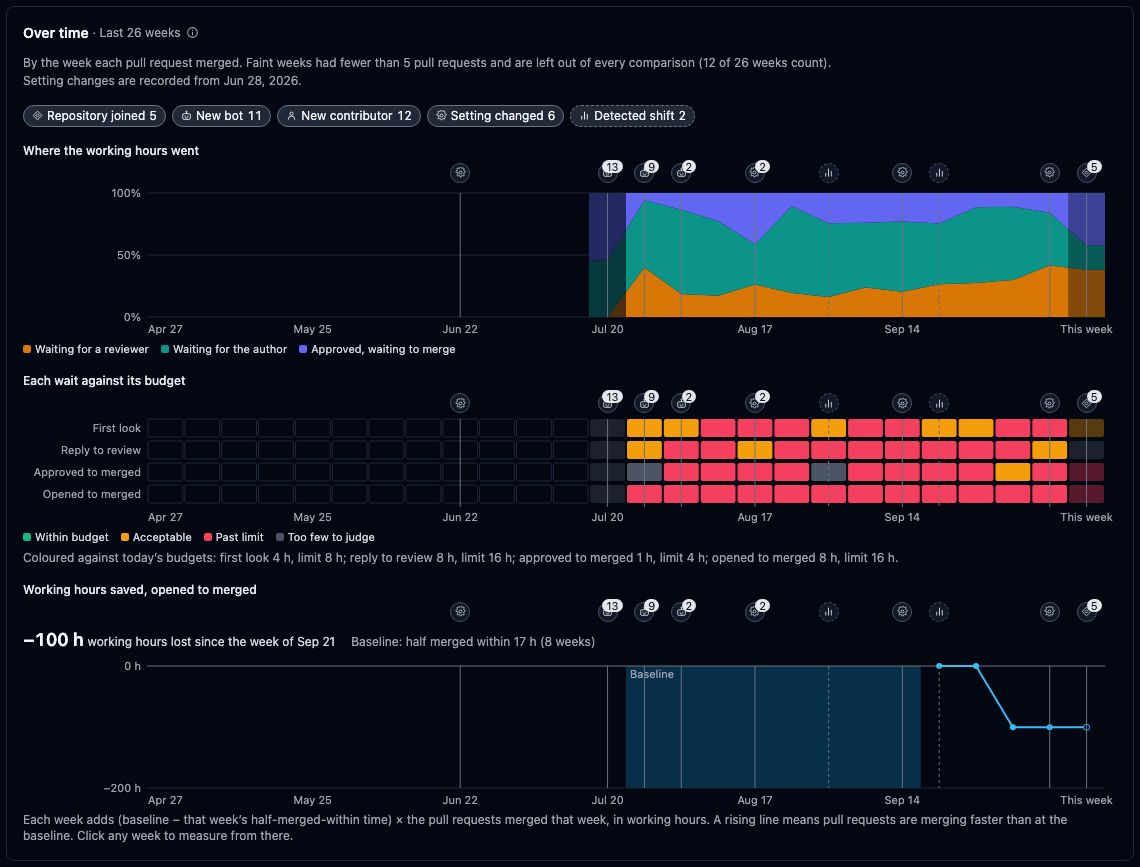
Over 26 weeks
Where the hours went each week, each wait against its budget, and the working hours saved. Markers show when a repo joined, a setting changed or a bot arrived.
Open a marker to compare before and after.
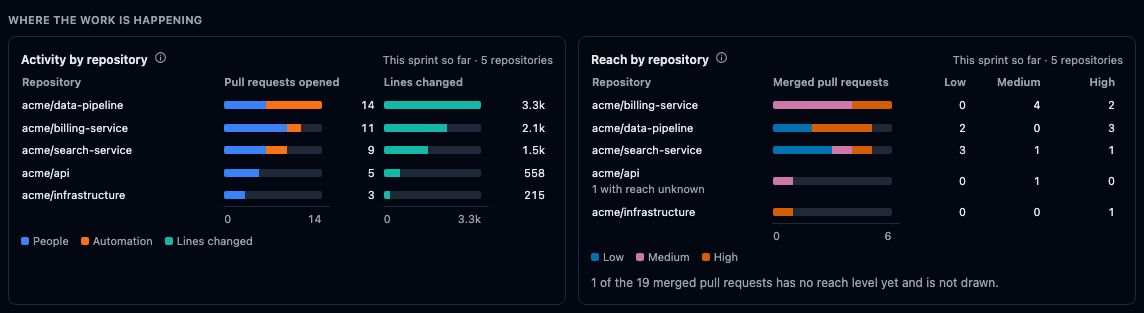
Where the work is happening
Which repositories carry the work, and how far each merged change could reach. Unknown is never shown as zero.
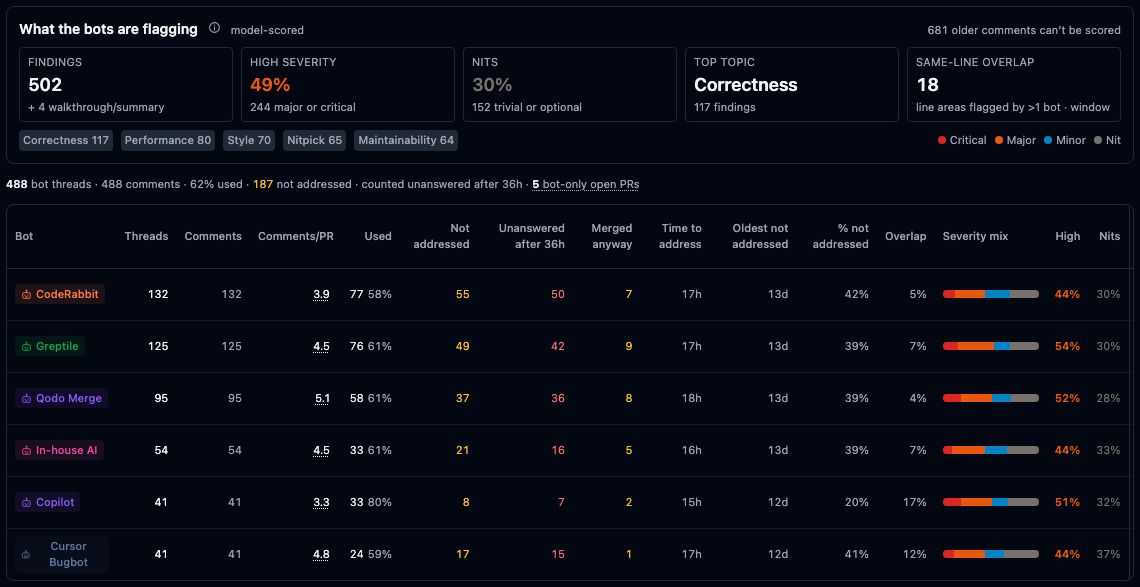
What your bots are worth
Bot comments graded nit, minor, major or critical by Limn's own model, on your own machine.
On 300 bot comments, the model agreed with an independent grader 70% of the time. CodeRabbit’s own label agreed 47% of the time, on the ones it labelled.
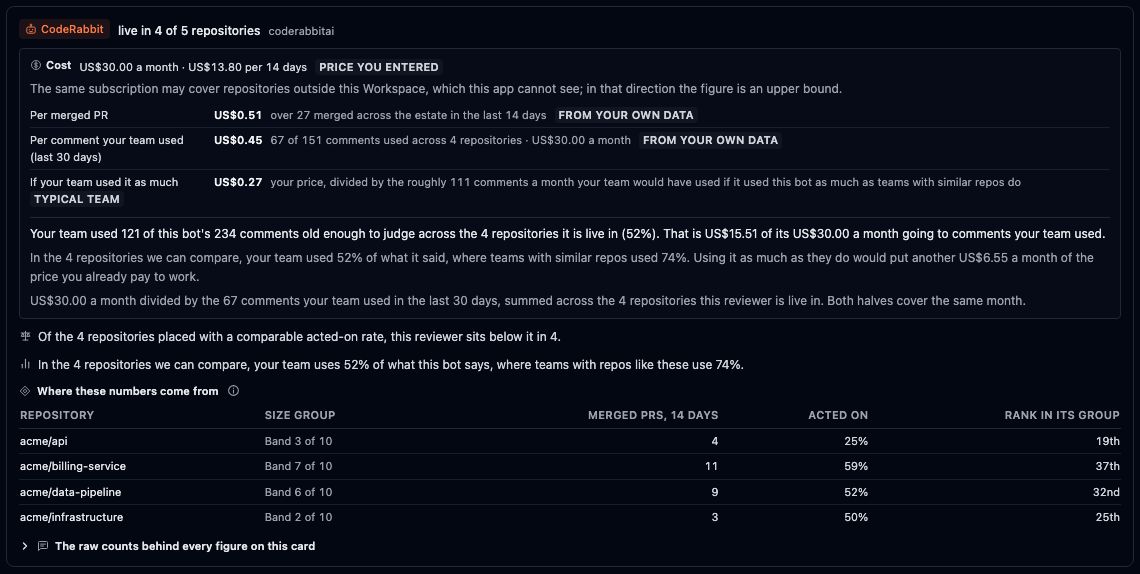
What each bot costs per comment your team acted on.
How each bot compares with the same bot in similar-sized public repositories, or a plain sentence saying why it can't. Cost is per workspace and never added up across workspaces.
For a bot whose comments your team rarely acts on, it says what turning it off would save in a year.
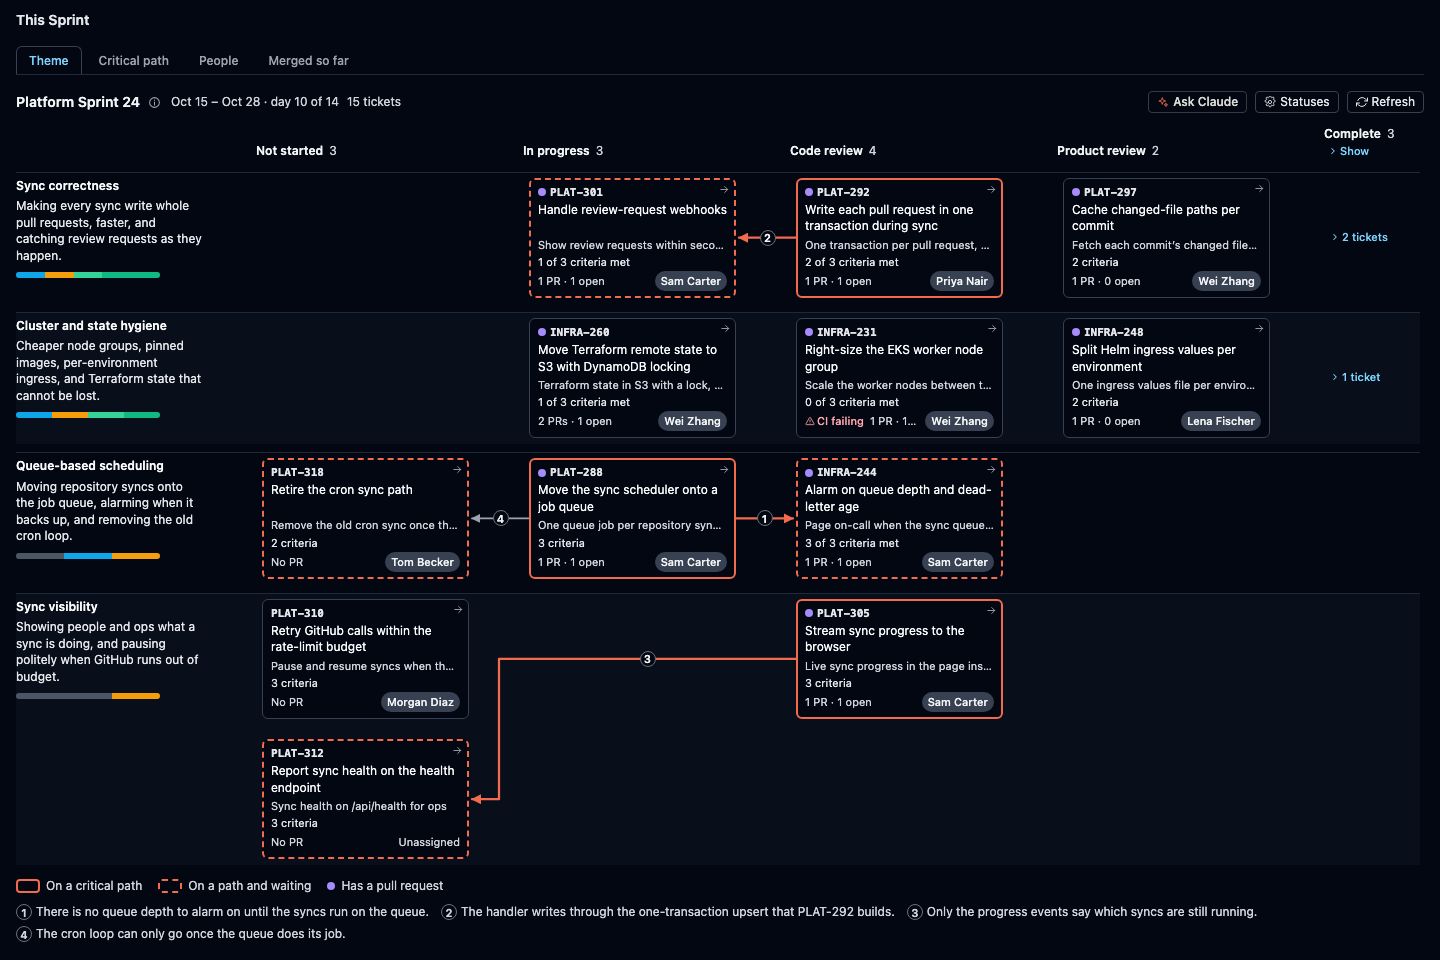
This Sprint
The sprint by theme, critical path or person, on your tracker's own status columns. Jira, Linear or GitHub Issues. Limn writes nothing back.
Themes and critical paths are written by your own AI agent.
See your own numbers
One command. No account. Or look around the demo first.
npx limn-review